The last two years have seen registration gains for the California Democratic Party. The last two years have also seen registration losses for the California Republican Party.
April 7th, 2006
Democratic: 6,646,082 (42.68%)
Republican: 5,382,707 (34.57%)
Registration Gap: 1,263,375 (8.11%)
April 4th, 2008
Democratic: 6,920,324 (43.54%)
Republican: 5,220,666 (32.84%)
Registration Gap: 1,699,658 (10.70%)
From the standpoint of statewide races, this is tremendously significant, since having more and more Democrats and fewer and fewer Republicans makes it just that much harder for a Republican to get elected in California. Look at 2006. Republicans thought that Ahnold could provide coattails for downballot offices. In the end, only Steve Poizner managed to win, running against the hapless Cruz Bustamante.
But the topline numbers only tell you so much. Ultimately, we want to know where our registration is increasing the most so that we know where the next pick-ups might be in Congress, the Assembly and the Senate. In this diary, I’m going to look at the registration changes on a County and Congressional district basis. I will look at the Senate and Assembly at a later time.
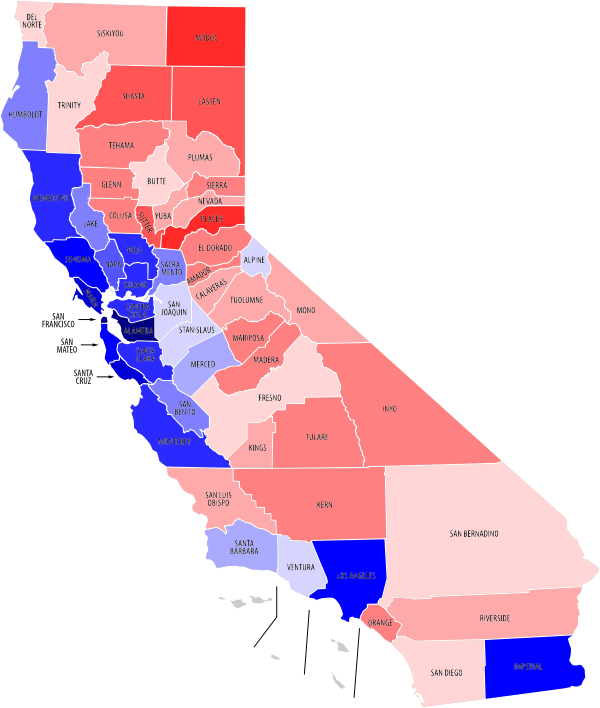
County Registration Gap 08
San Francisco: 45.36%
Alameda: 40.17%
Santa Cruz: 34.32%
Marin: 32.24%
Imperial: 29.62%
San Mateo: 27.36%
Sonoma: 26.64%
Los Angeles: 25.39%
Mendocino: 22.99%
Solano: 22.01%
Contra Costa: 20.90%
Yolo: 20.77%
Monterey: 20.27%
Santa Clara: 20.10%
Napa: 16.82%
Humboldt: 14.02%
San Benito: 13.64%
Lake: 12.28%
California: 10.70%
Sacramento: 10.51%
Santa Barbara: 7.38%
Merced: 7.25%
San Joaquin: 3.65%
Stanislaus: 1.38%
Alpine: 1.29%
Ventura: 0.79%
Del Norte: -0.81%
San Bernardino: -1.38%
Trinity: -1.95%
San Diego: -2.80%
Fresno: -3.10%
Butte: -4.88%
Mono: -5.80%
San Luis Obispo: -5.86%
Yuba: -6.33%
Siskiyou: -6.87%
Riverside: -7.74%
Tuolumne: -7.93%
Nevada: -8.40%
Calaveras: -9.54%
Kings: -9.75%
Plumas: -9.84%
Kern: -10.68%
Amador: -10.88%
Colusa: -11.46%
Tehama: -11.69%
Tulare: -11.71%
Sierra: -12.11%
Inyo: -12.51%
Madera: -12.66%
Mariposa: -14.25%
Glenn: -14.28%
El Dorado: -14.96%
Orange: -14.98%
Sutter: -15.35%
Lassen: -18.28%
Shasta: -18.40%
Modoc: -20.73%
Placer: -20.74%
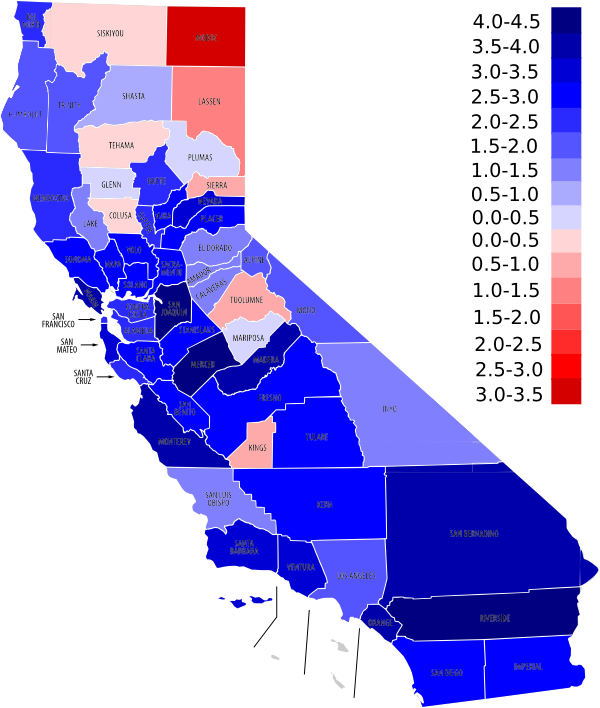
Change in Gap between April 2006 and April 2008
Merced: 4.22%
San Joaquin: 4.05%
Riverside: 4.00%
Marin: 3.87%
San Bernardino: 3.78%
Orange: 3.71%
Monterey: 3.58%
Madera: 3.54%
Ventura: 3.41%
San Mateo: 3.23%
Santa Barbara: 3.14%
Nevada: 3.00%
Kern: 2.91%
Yuba: 2.88%
Fresno: 2.84%
Sonoma: 2.79%
San Diego: 2.78%
Sacramento: 2.68%
Solano: 2.68%
Imperial: 2.63%
Yolo: 2.62%
California: 2.59%
Santa Clara: 2.58%
Placer: 2.58%
Tulare 2.55%
Stanislaus 2.51%
Napa 2.51%
San Benito 2.51%
Alameda 2.42%
Contra Costa 2.41%
Sutter 2.38%
Mendocino 2.30%
San Francisco 2.28%
Santa Cruz 2.21%
Del Norte 2.10%
Butte 2.05%
Humboldt 1.97%
Los Angeles 1.92%
Alpine 1.80%
Mono 1.74%
Trinity 1.50%
Calaveras 1.31%
San Luis Obispo 1.21%
Amador 1.18%
Lake 1.17%
Inyo 1.09%
El Dorado 1.08%
Shasta 0.73%
Glenn 0.46%
Mariposa 0.36%
Plumas 0.20%
Tehama -0.01%
Siskiyou -0.32%
Colusa -0.34%
Tuolumne -0.54%
Sierra -0.61%
Kings -0.93%
Lassen -1.45%
Modoc -3.10%